Sovereign Value by Year: The Full Chart
Every year of the gold sovereign and half sovereign with mintage and the median realised price from verified sales — real hammer prices from the last twelve months, not asking prices, recalculated as new sales land. 1,161 verified sovereign sales sit behind the chart. Values shown blend all grades; scarce years with too few sales show a dash rather than a guess.
Full sovereign value by year
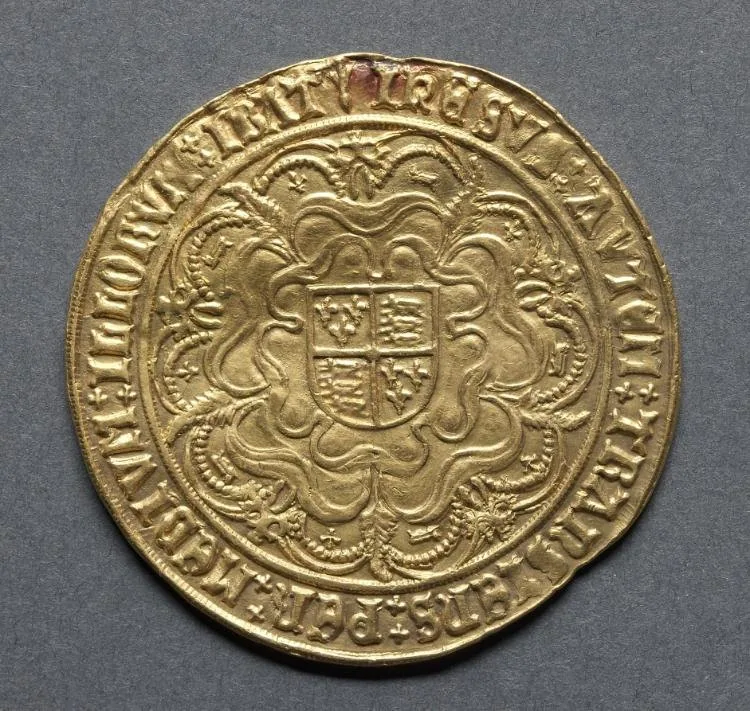
Principal circulation strike per year. Median realised covers all grades sold in the last twelve months; years with fewer than 3 verified sales show a dash — click the year for whatever individual sales exist.
| Year | Monarch | Mintage | Sales (12m) | Median realised |
|---|---|---|---|---|
| 1817 | George III | 3,235,000 | 18 | £1,500 |
| 1821 | George IV | 9,405,000 | 27 | £1,231 |
| 1825 | George IV | – | 10 | £1,400 |
| 1831 | William IV | 599,000 | 8 | £3,800 |
| 1838 | Victoria | 2,718,694 | 5 | £6,000 |
| 1871 | Victoria | 8,767,250 | 33 | £1,050 |
| 1887 | Victoria | 1,111,280 | 58 | £971 |
| 1893 | Victoria | 6,898,260 | 28 | £815 |
| 1902 | Edward VII | 4,738,000 | 49 | £889 |
| 1908 | Edward VII | 636 | 0 | – |
| 1911 | George V | 30,044,000 | 99 | £853 |
| 1918 | George V | 1,296,033 | 1 | – |
| 1936 | Edward VIII | – | 1 | – |
| 1937 | George VI | 5,501 | 4 | £2,800 |
| 1957 | Elizabeth II | 2,072,000 | 32 | £955 |
| 1974 | Elizabeth II | 5,002,566 | 24 | £838 |
| 1981 | Elizabeth II | 40,000 | 0 | – |
| 1986 | Elizabeth II | 12 | 0 | – |
| 1989 | Elizabeth II | 23,471 | 22 | £1,599 |
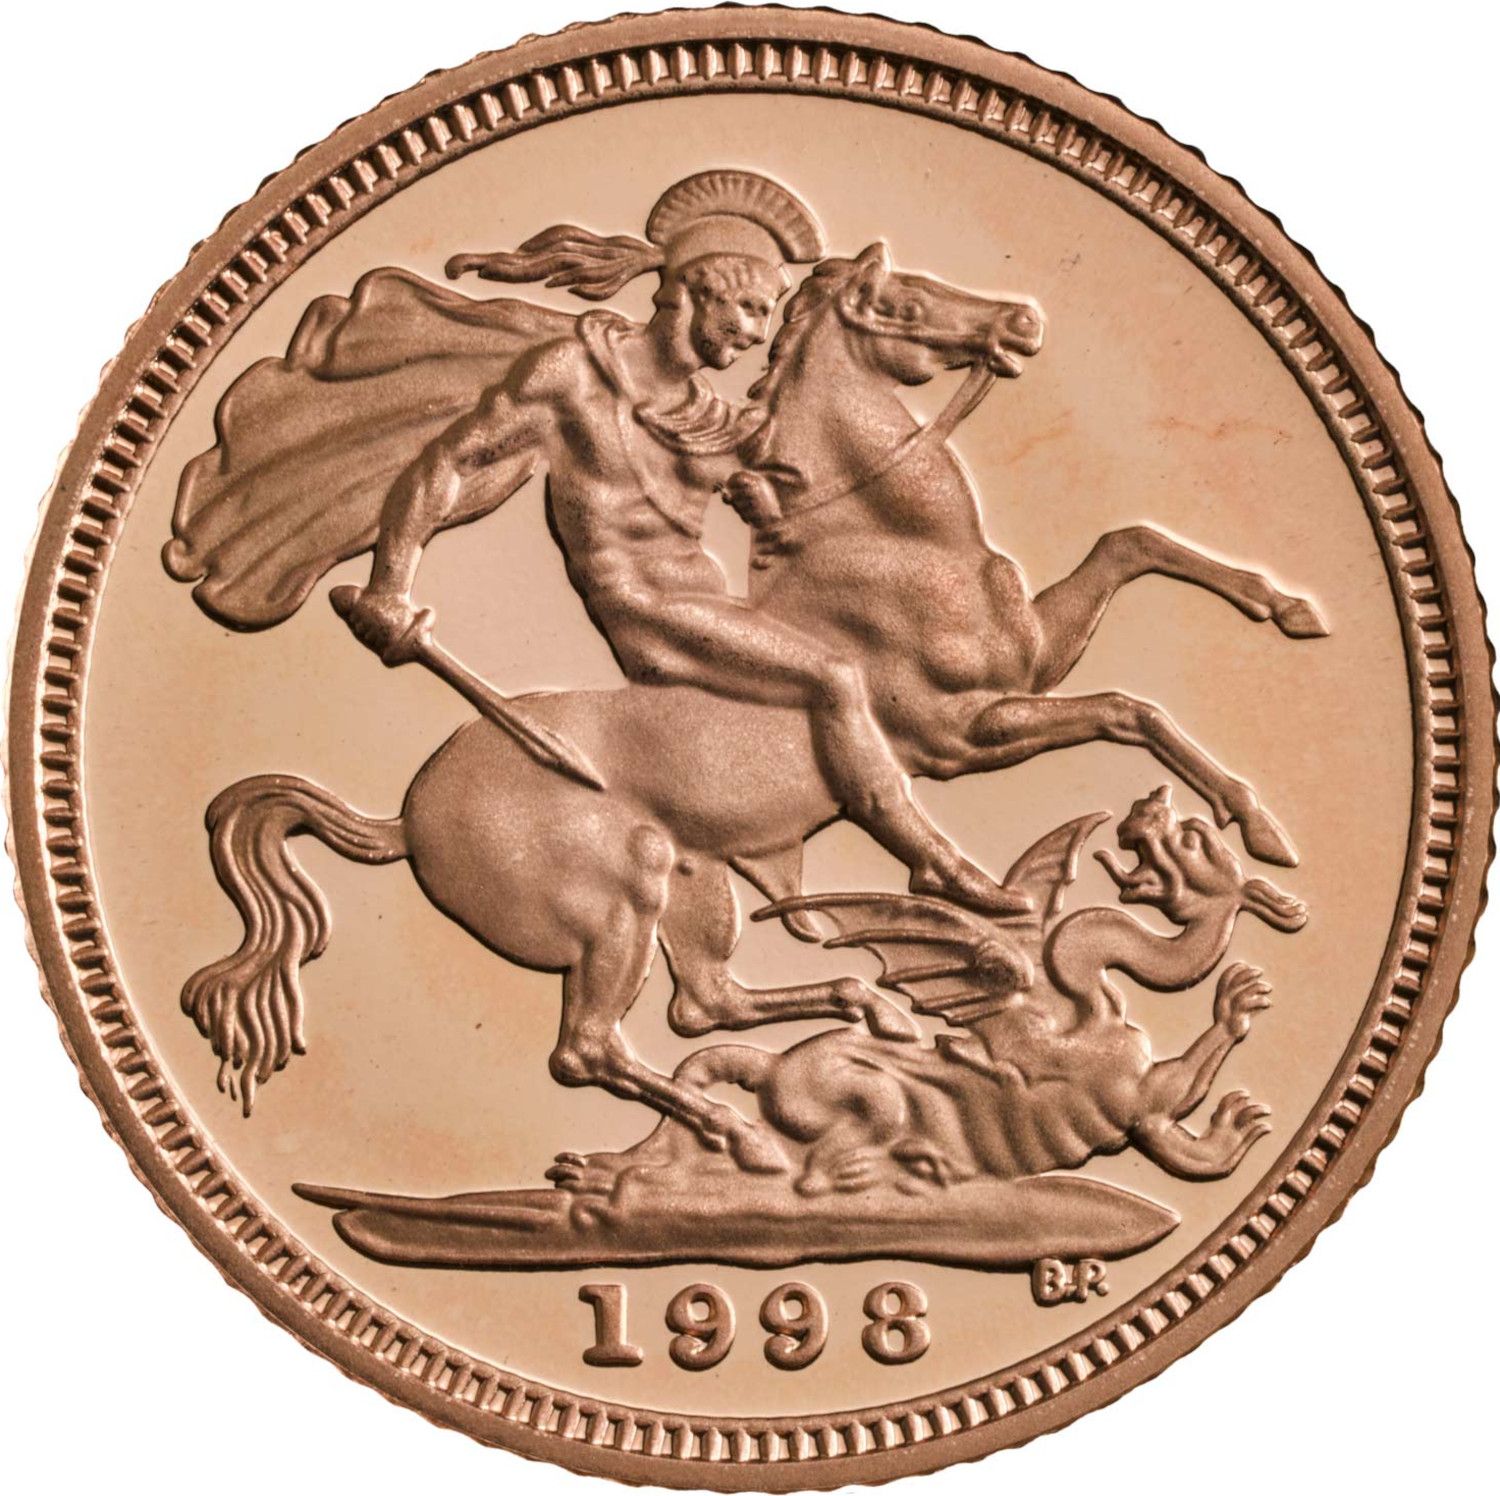
| 1998 | Elizabeth II | 11,349 | 0 | – |
| 1999 | Elizabeth II | – | 0 | – |
| 2000 | Elizabeth II | 2,000 | 0 | – |
| 2002 | Elizabeth II | 75,264 | 12 | £875 |
| 2005 | Elizabeth II | 45,542 | 24 | £871 |
| 2009 | Elizabeth II | 398 | 0 | – |
| 2010 | Elizabeth II | – | 0 | – |
| 2012 | Elizabeth II | 432,925 | 10 | £920 |
| 2013 | Elizabeth II | 94,790 | 0 | – |
| 2015 | Elizabeth II | 301 | 33 | £869 |
| 2016 | Elizabeth II | 45,000 | 1 | – |
| 2017 | Elizabeth II | 1,786 | 4 | £1,100 |
| 2018 | Elizabeth II | 323 | 2 | – |
| 2019 | Elizabeth II | 647 | 1 | – |
| 2020 | Elizabeth II | 575 | 2 | – |
| 2021 | Elizabeth II | 2,021 | 2 | – |
| 2022 | Elizabeth II | 1,350 | 85 | £874 |
| 2023 | Charles III | 1,290 | 25 | £900 |
| 2024 | Charles III | 195 | 0 | – |
| 2025 | Charles III | 100 | 5 | £1,150 |
| 2026 | Charles III | 500 | 53 | £879 |
Half sovereign value by year
The half sovereign runs on its own market: half the gold (3.66 g fine) but its own scarce dates, and demand from collectors who specialise in the smaller coin.
| Year | Monarch | Mintage | Sales (12m) | Median realised |
|---|---|---|---|---|
| 1817 | George III | 2,080,100 | 15 | £664 |
| 1821 | George IV | 231,200 | 3 | £15 |
| 1823 | George IV | 224,200 | 0 | – |
| 1826 | George IV | 344,800 | 4 | £1,435 |
| 1831 | William IV | – | 0 | – |
| 1835 | William IV | 772,500 | 0 | – |
| 1838 | Victoria | 273,000 | 1 | – |
| 1887 | Victoria | 871,770 | 38 | £466 |
| 1893 | Victoria | 4,426,625 | 16 | £517 |
| 1902 | Edward VII | 4,244,457 | 56 | £461 |
| 1911 | George V | 6,104,000 | 62 | £426 |
| 1937 | George VI | 5,501 | 15 | £1,232 |
| 1973 | Elizabeth II | 1,250 | 0 | – |
| 1980 | Elizabeth II | 86,700 | 36 | £500 |
| 1981 | Elizabeth II | 30,000 | 0 | – |
| 1989 | Elizabeth II | 21,824 | 18 | £675 |
| 1998 | Elizabeth II | 7,496 | 1 | – |
| 1999 | Elizabeth II | – | 0 | – |
| 2002 | Elizabeth II | 61,347 | 3 | £486 |
| 2005 | Elizabeth II | 30,299 | 6 | £620 |
| 2009 | Elizabeth II | – | 0 | – |
| 2011 | Elizabeth II | 5,287 | 0 | – |
| 2012 | Elizabeth II | – | 0 | – |
| 2014 | Elizabeth II | 62,000 | 0 | – |
| 2015 | Elizabeth II | 1,046 | 0 | – |
| 2016 | Elizabeth II | 3,661 | 0 | – |
| 2017 | Elizabeth II | 4,648 | 0 | – |
| 2018 | Elizabeth II | 1,099 | 0 | – |
| 2019 | Elizabeth II | 1,839 | 0 | – |
| 2020 | Elizabeth II | 999 | 0 | – |
| 2021 | Elizabeth II | 1,971 | 0 | – |
| 2022 | Elizabeth II | 499 | 11 | £517 |
| 2023 | Charles III | – | 5 | £568 |
| 2024 | Charles III | 499 | 1 | – |
| 2025 | Charles III | 799 | 0 | – |
| 2026 | Charles III | 999 | 3 | £687 |
How to read the chart for your coin
- Find the year and note the median — that is the market's centre across all grades, not a promise for your coin.
- Check the mint mark. A branch-mint strike (S, M, P, C, I, SA above the date) can be a different market entirely — see the mint marks guide.
- Judge the grade honestly. Worn common dates sit at bullion; high grades multiply. Start with the grading guide.
- Mind the floor. No genuine sovereign is worth less than its gold. The sovereign value calculator gives today's melt floor live, and today’s gold price shows the spot it is based on.
- Authenticate before you celebrate. Scarce dates attract fakes — run the six-test check first.
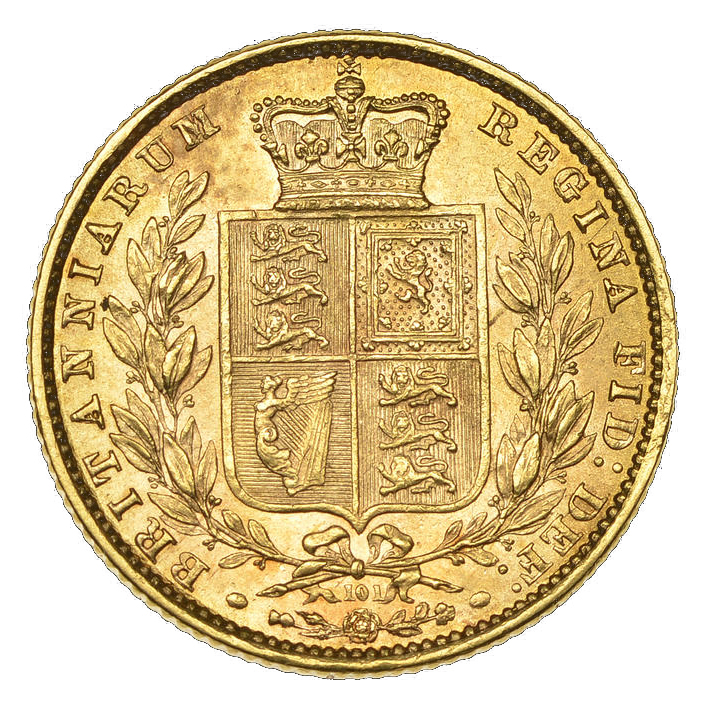
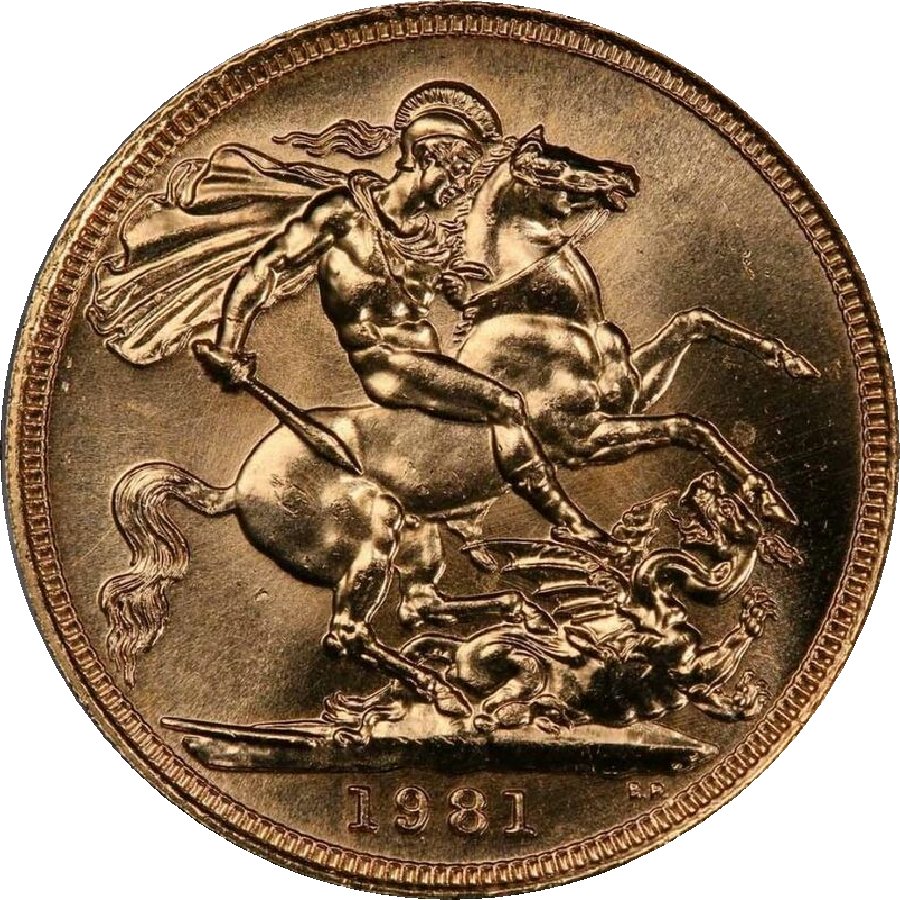
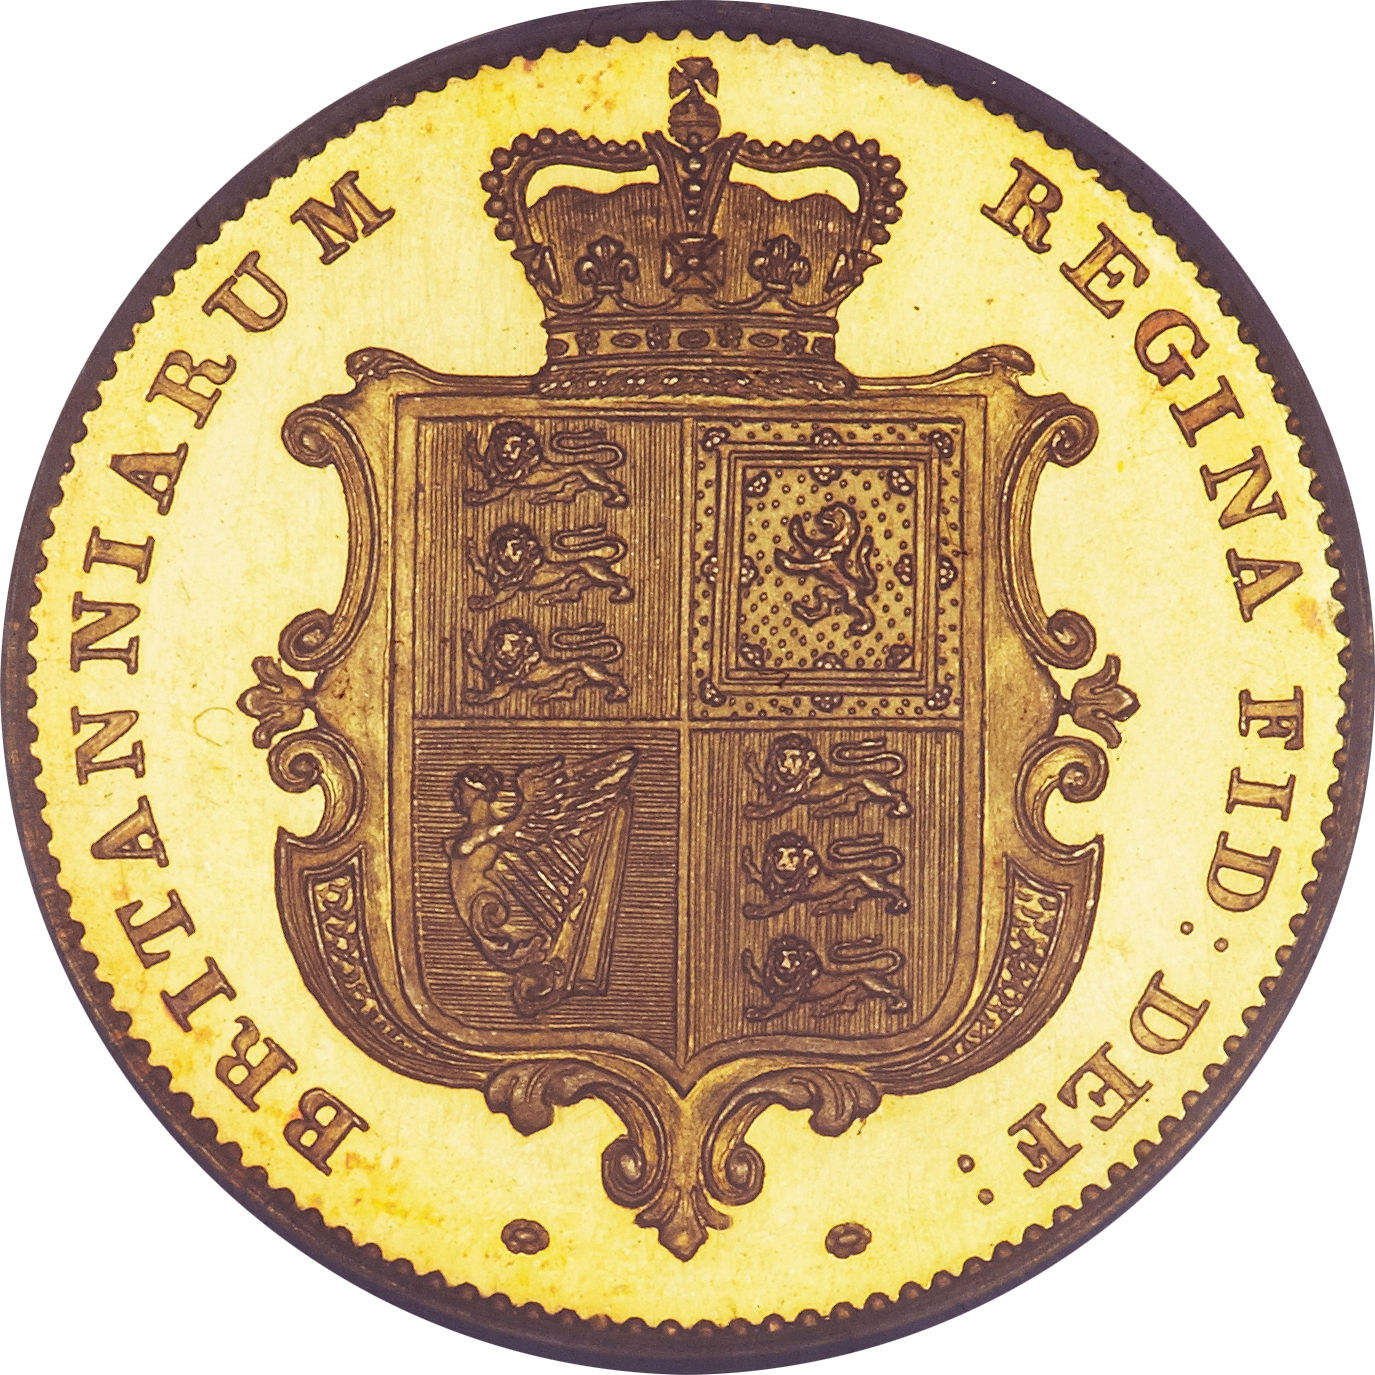
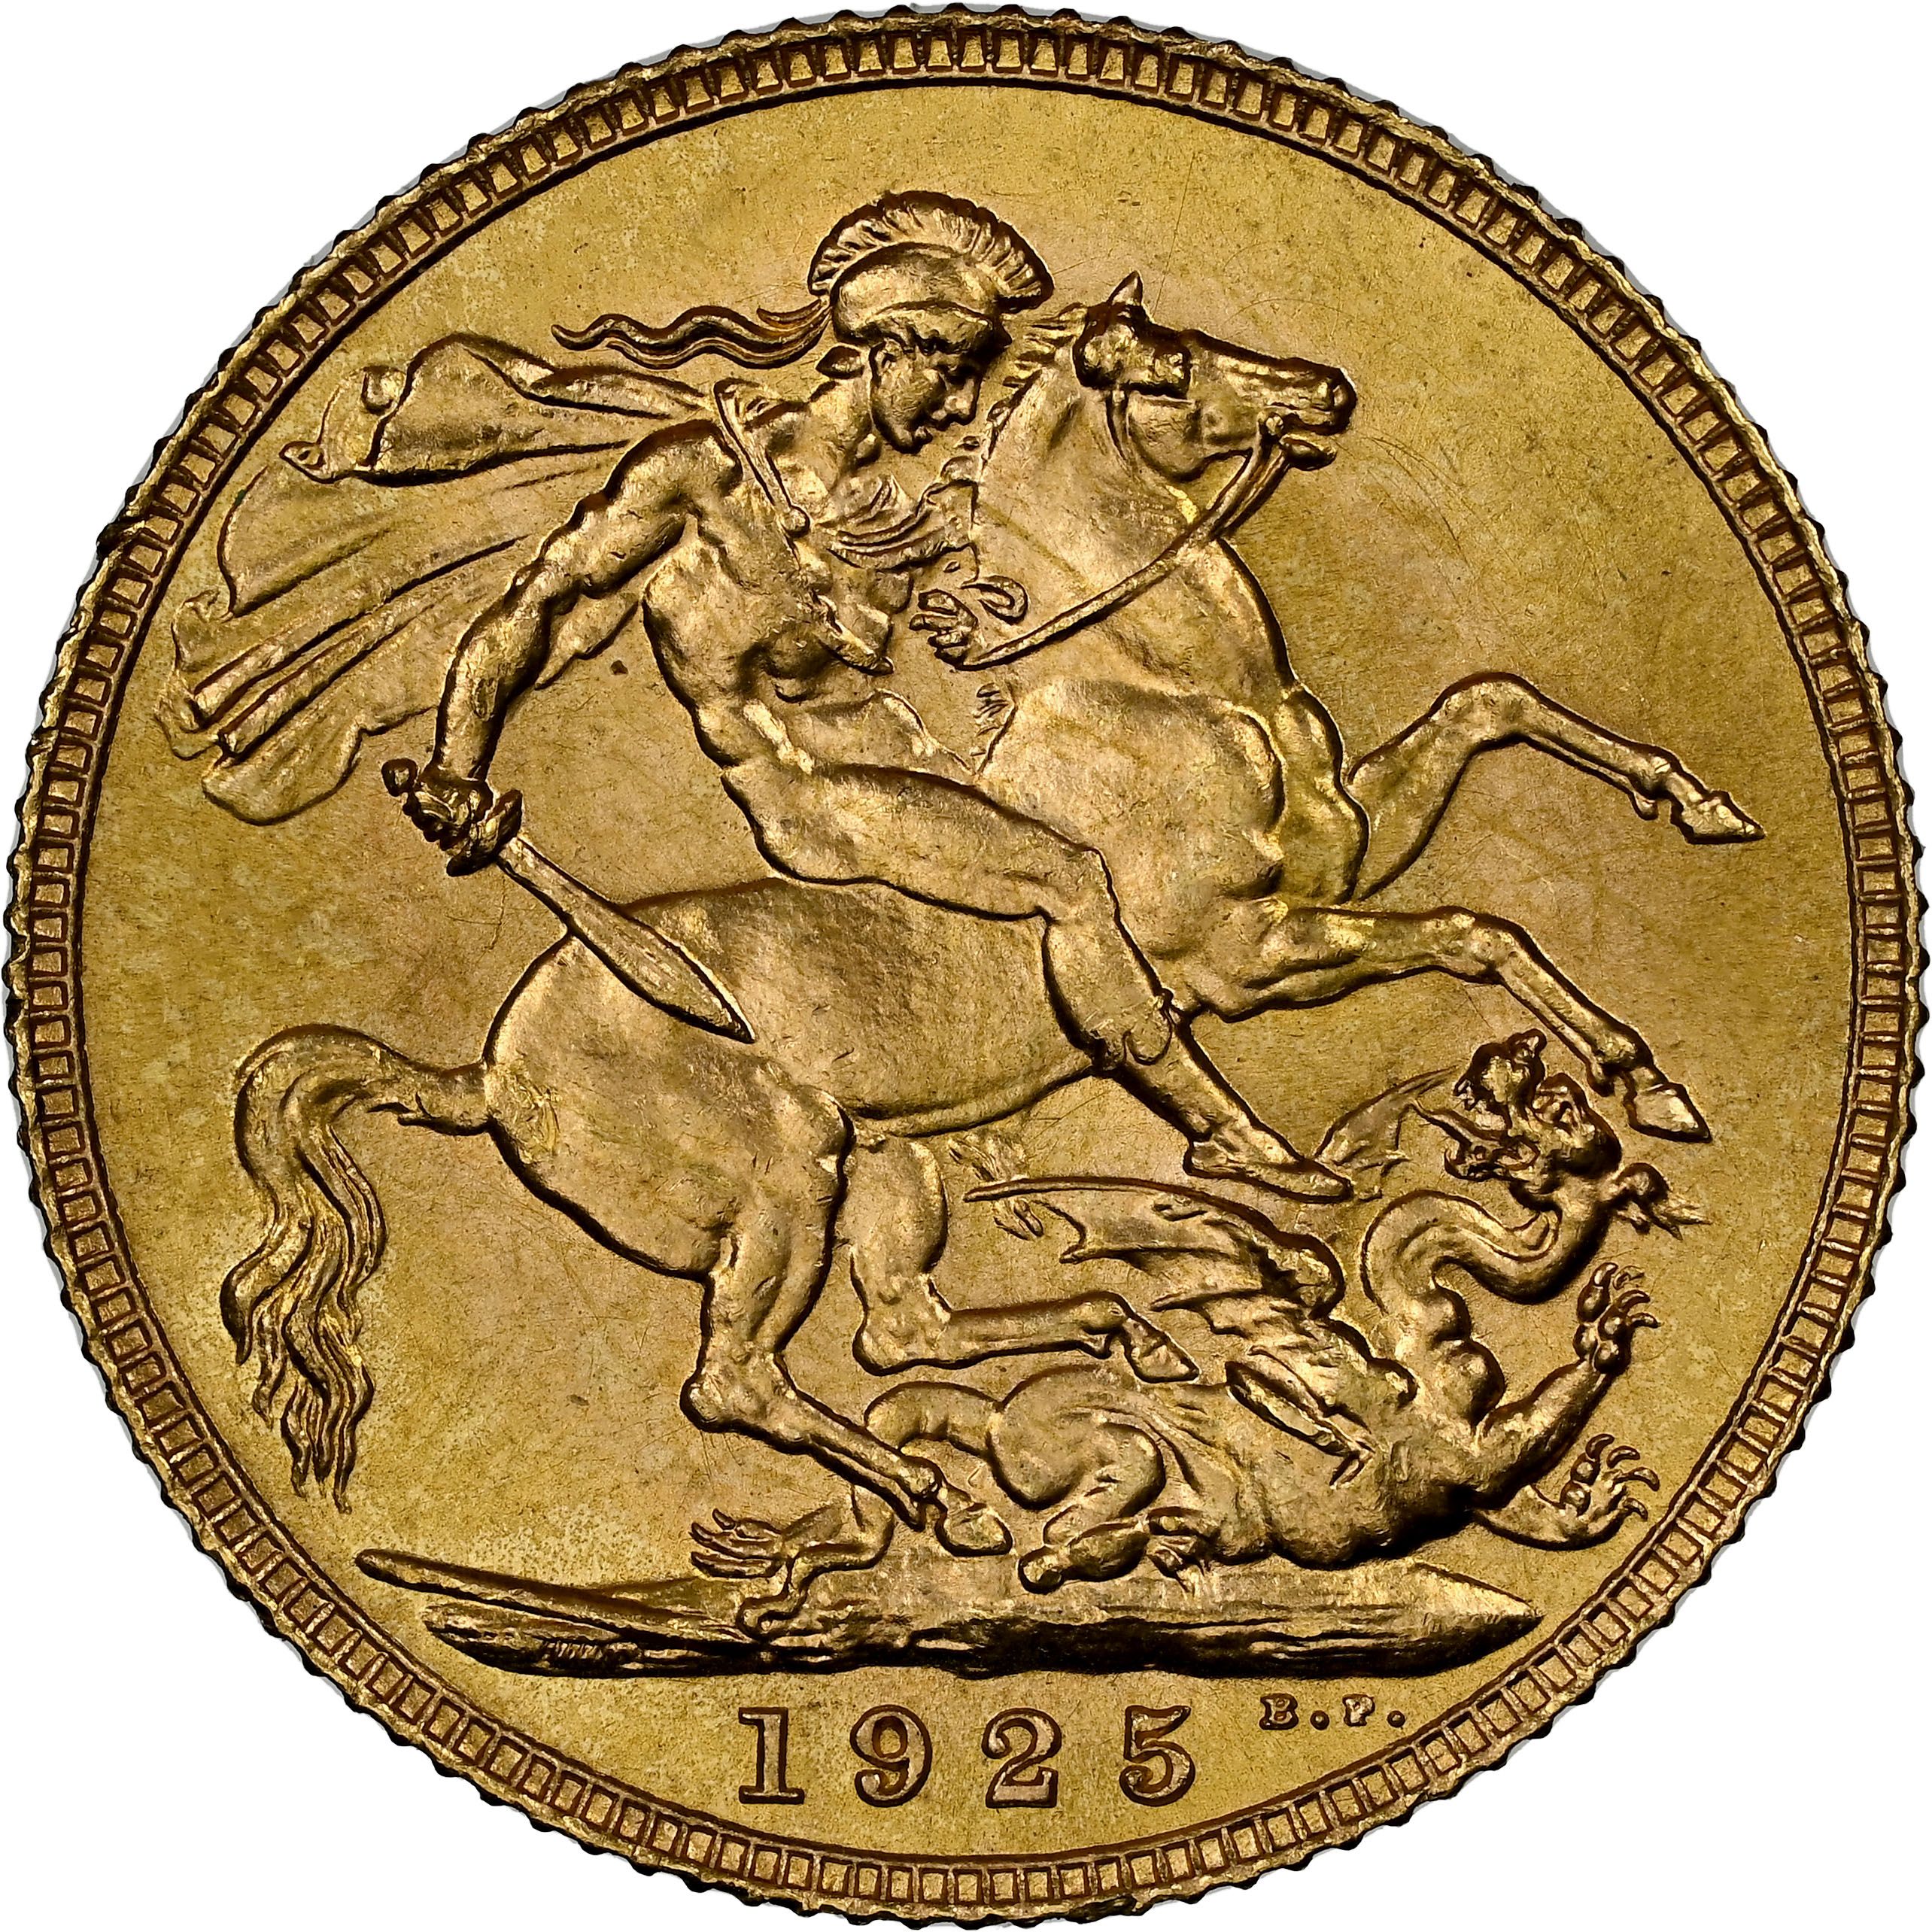
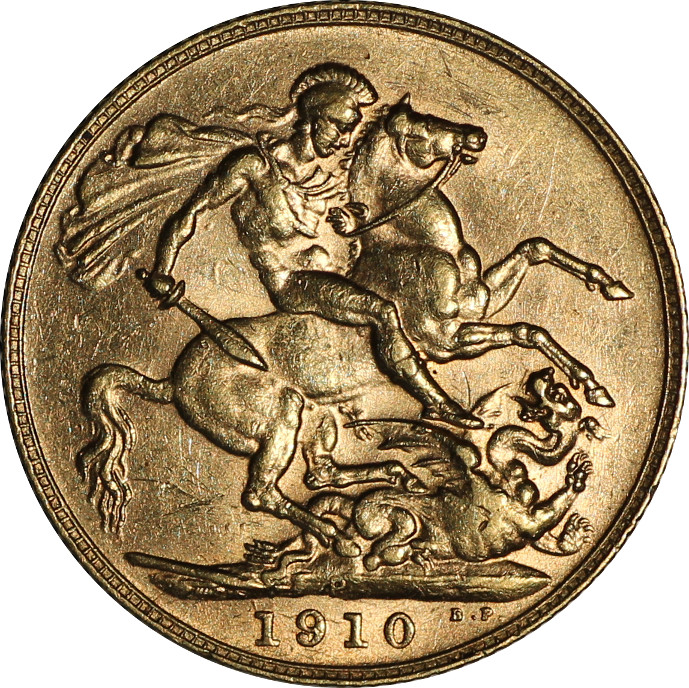
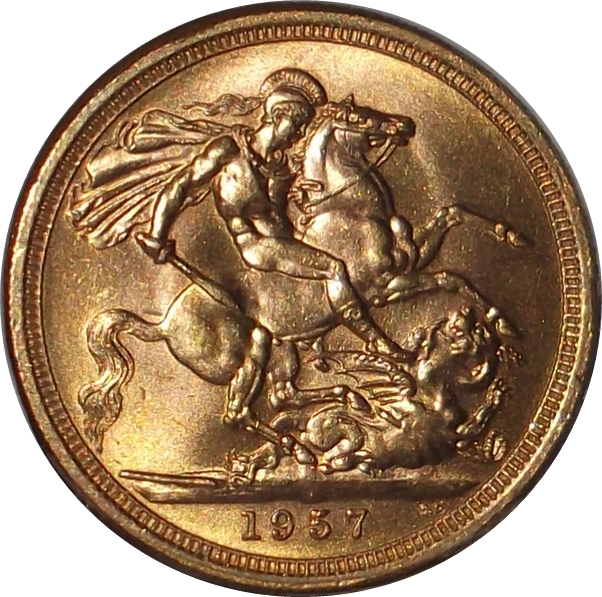
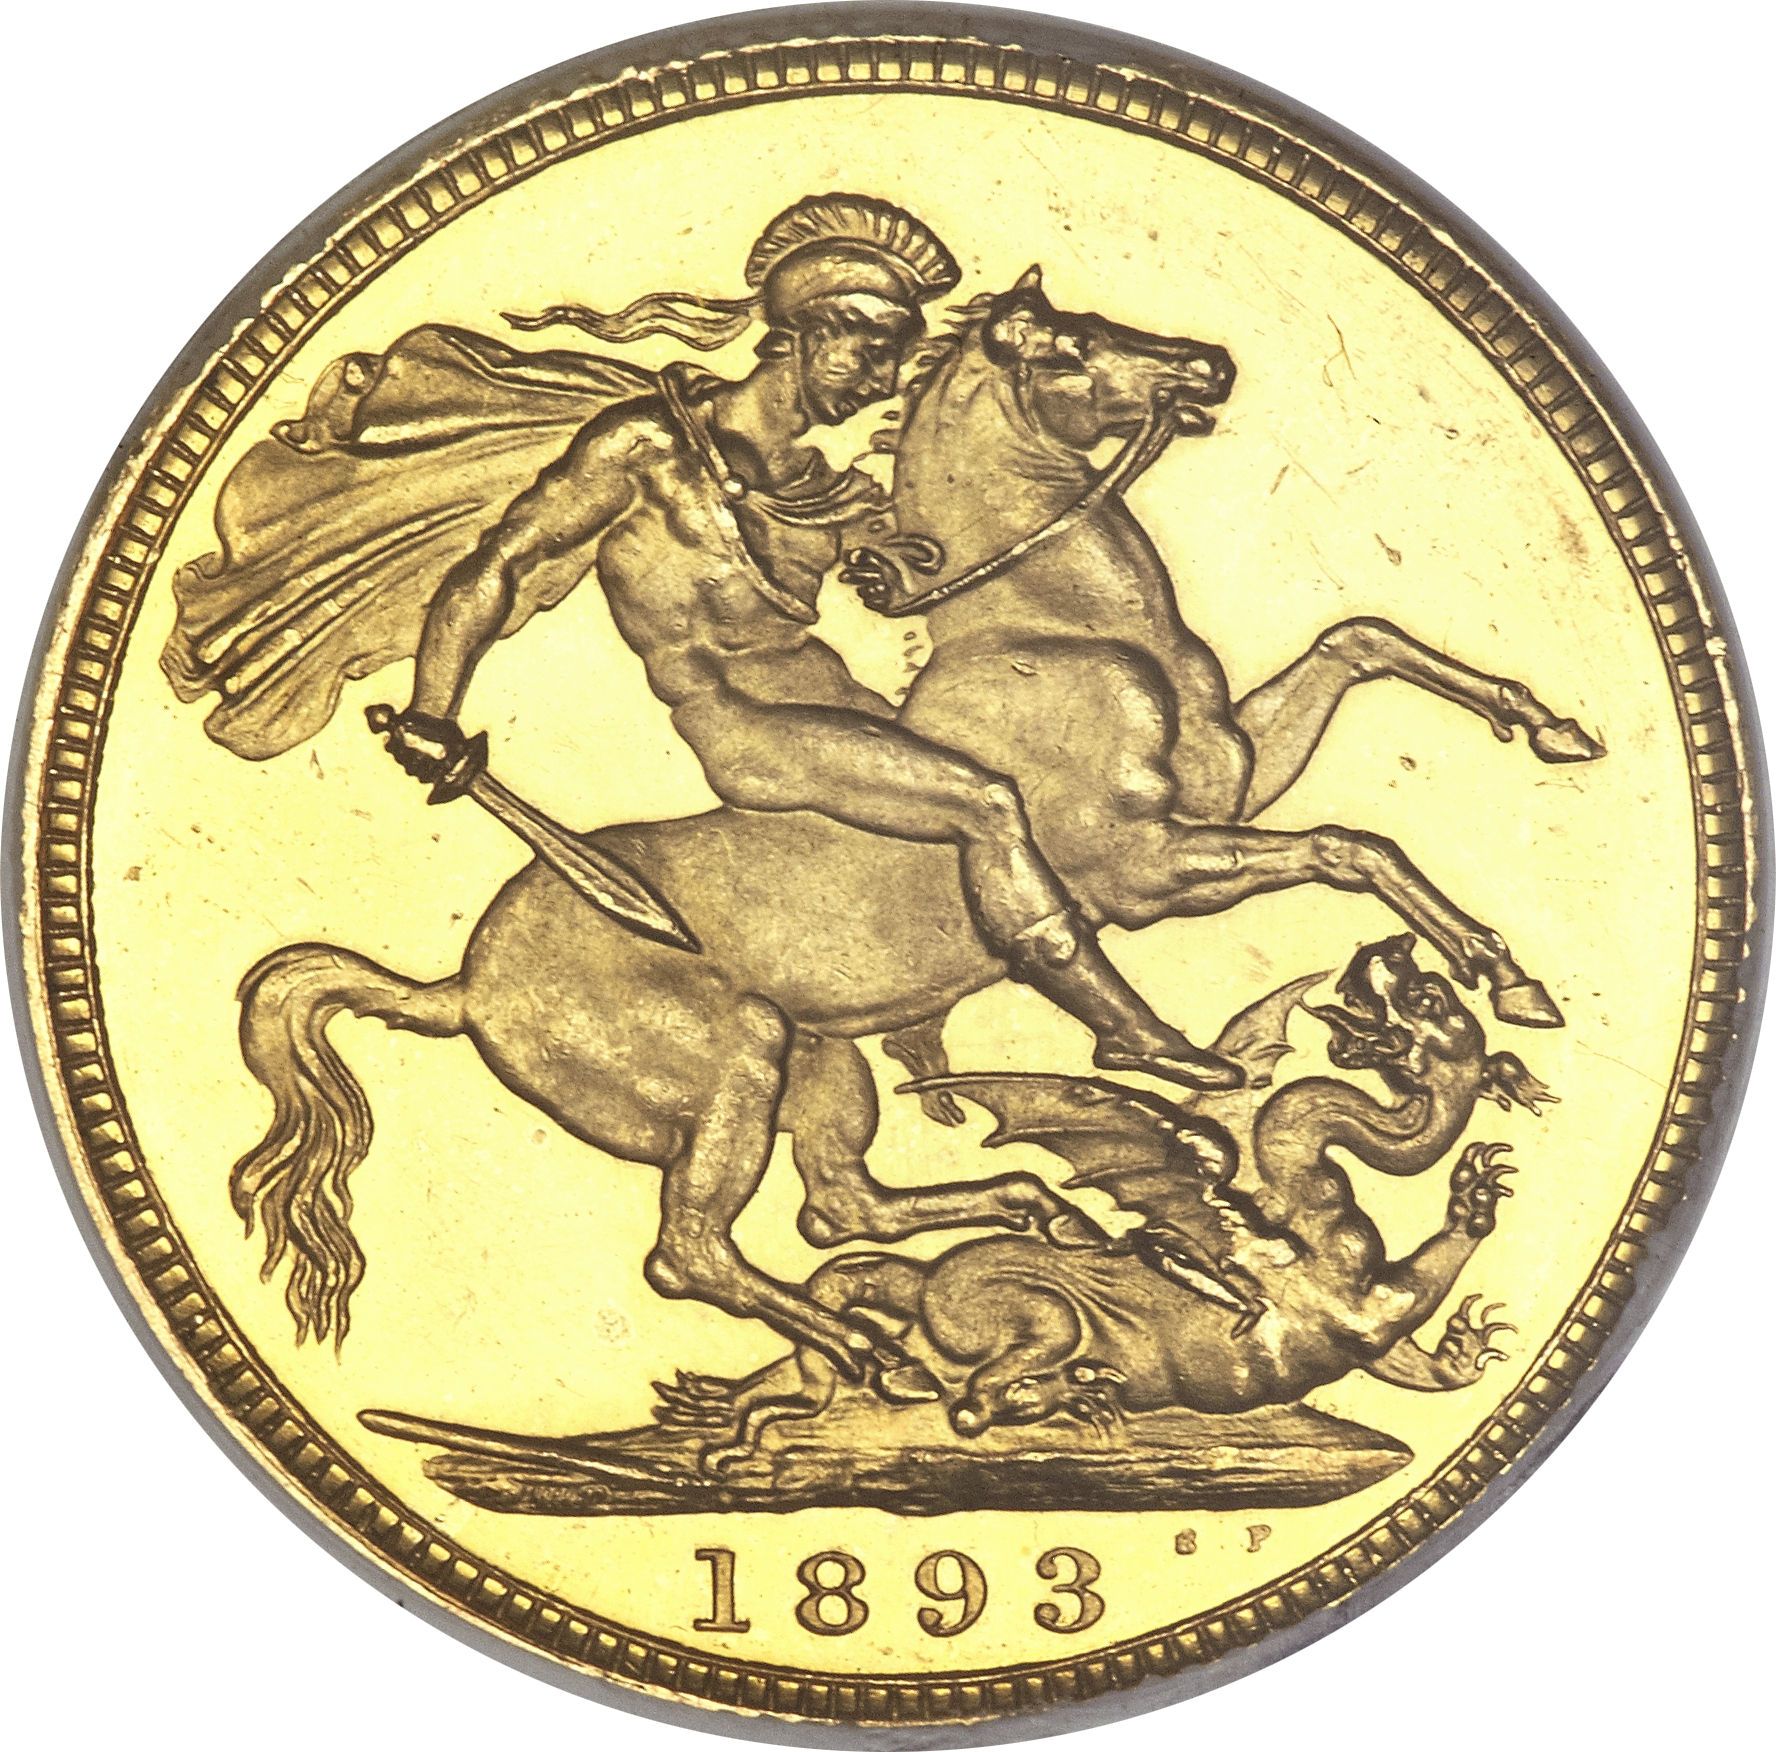
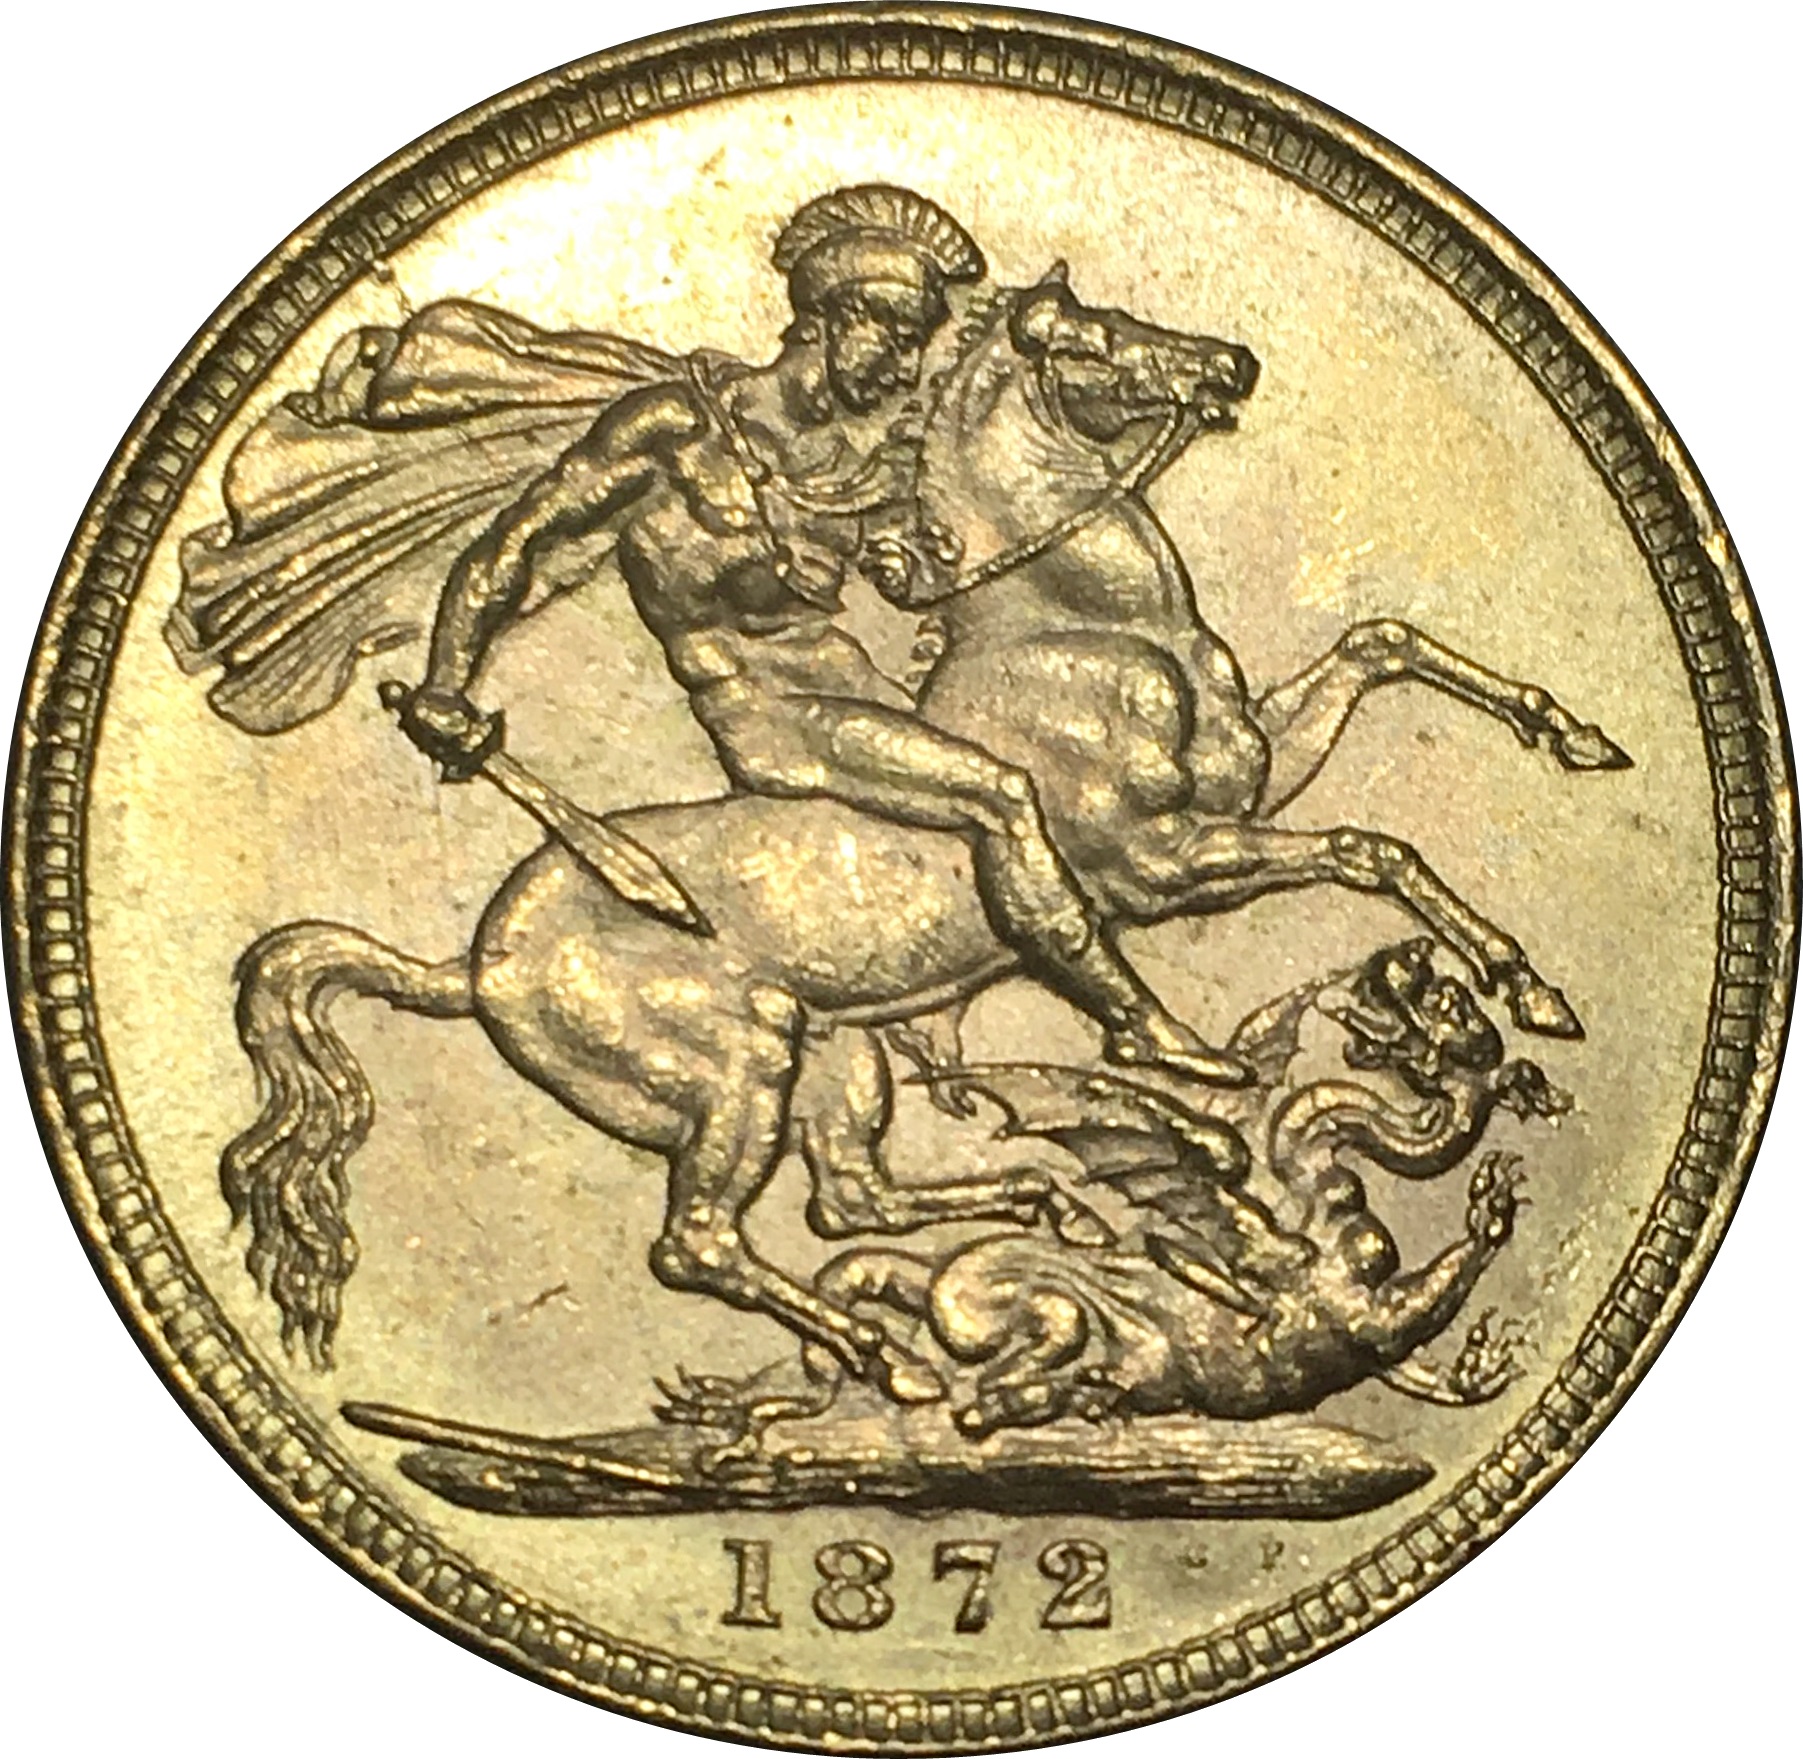
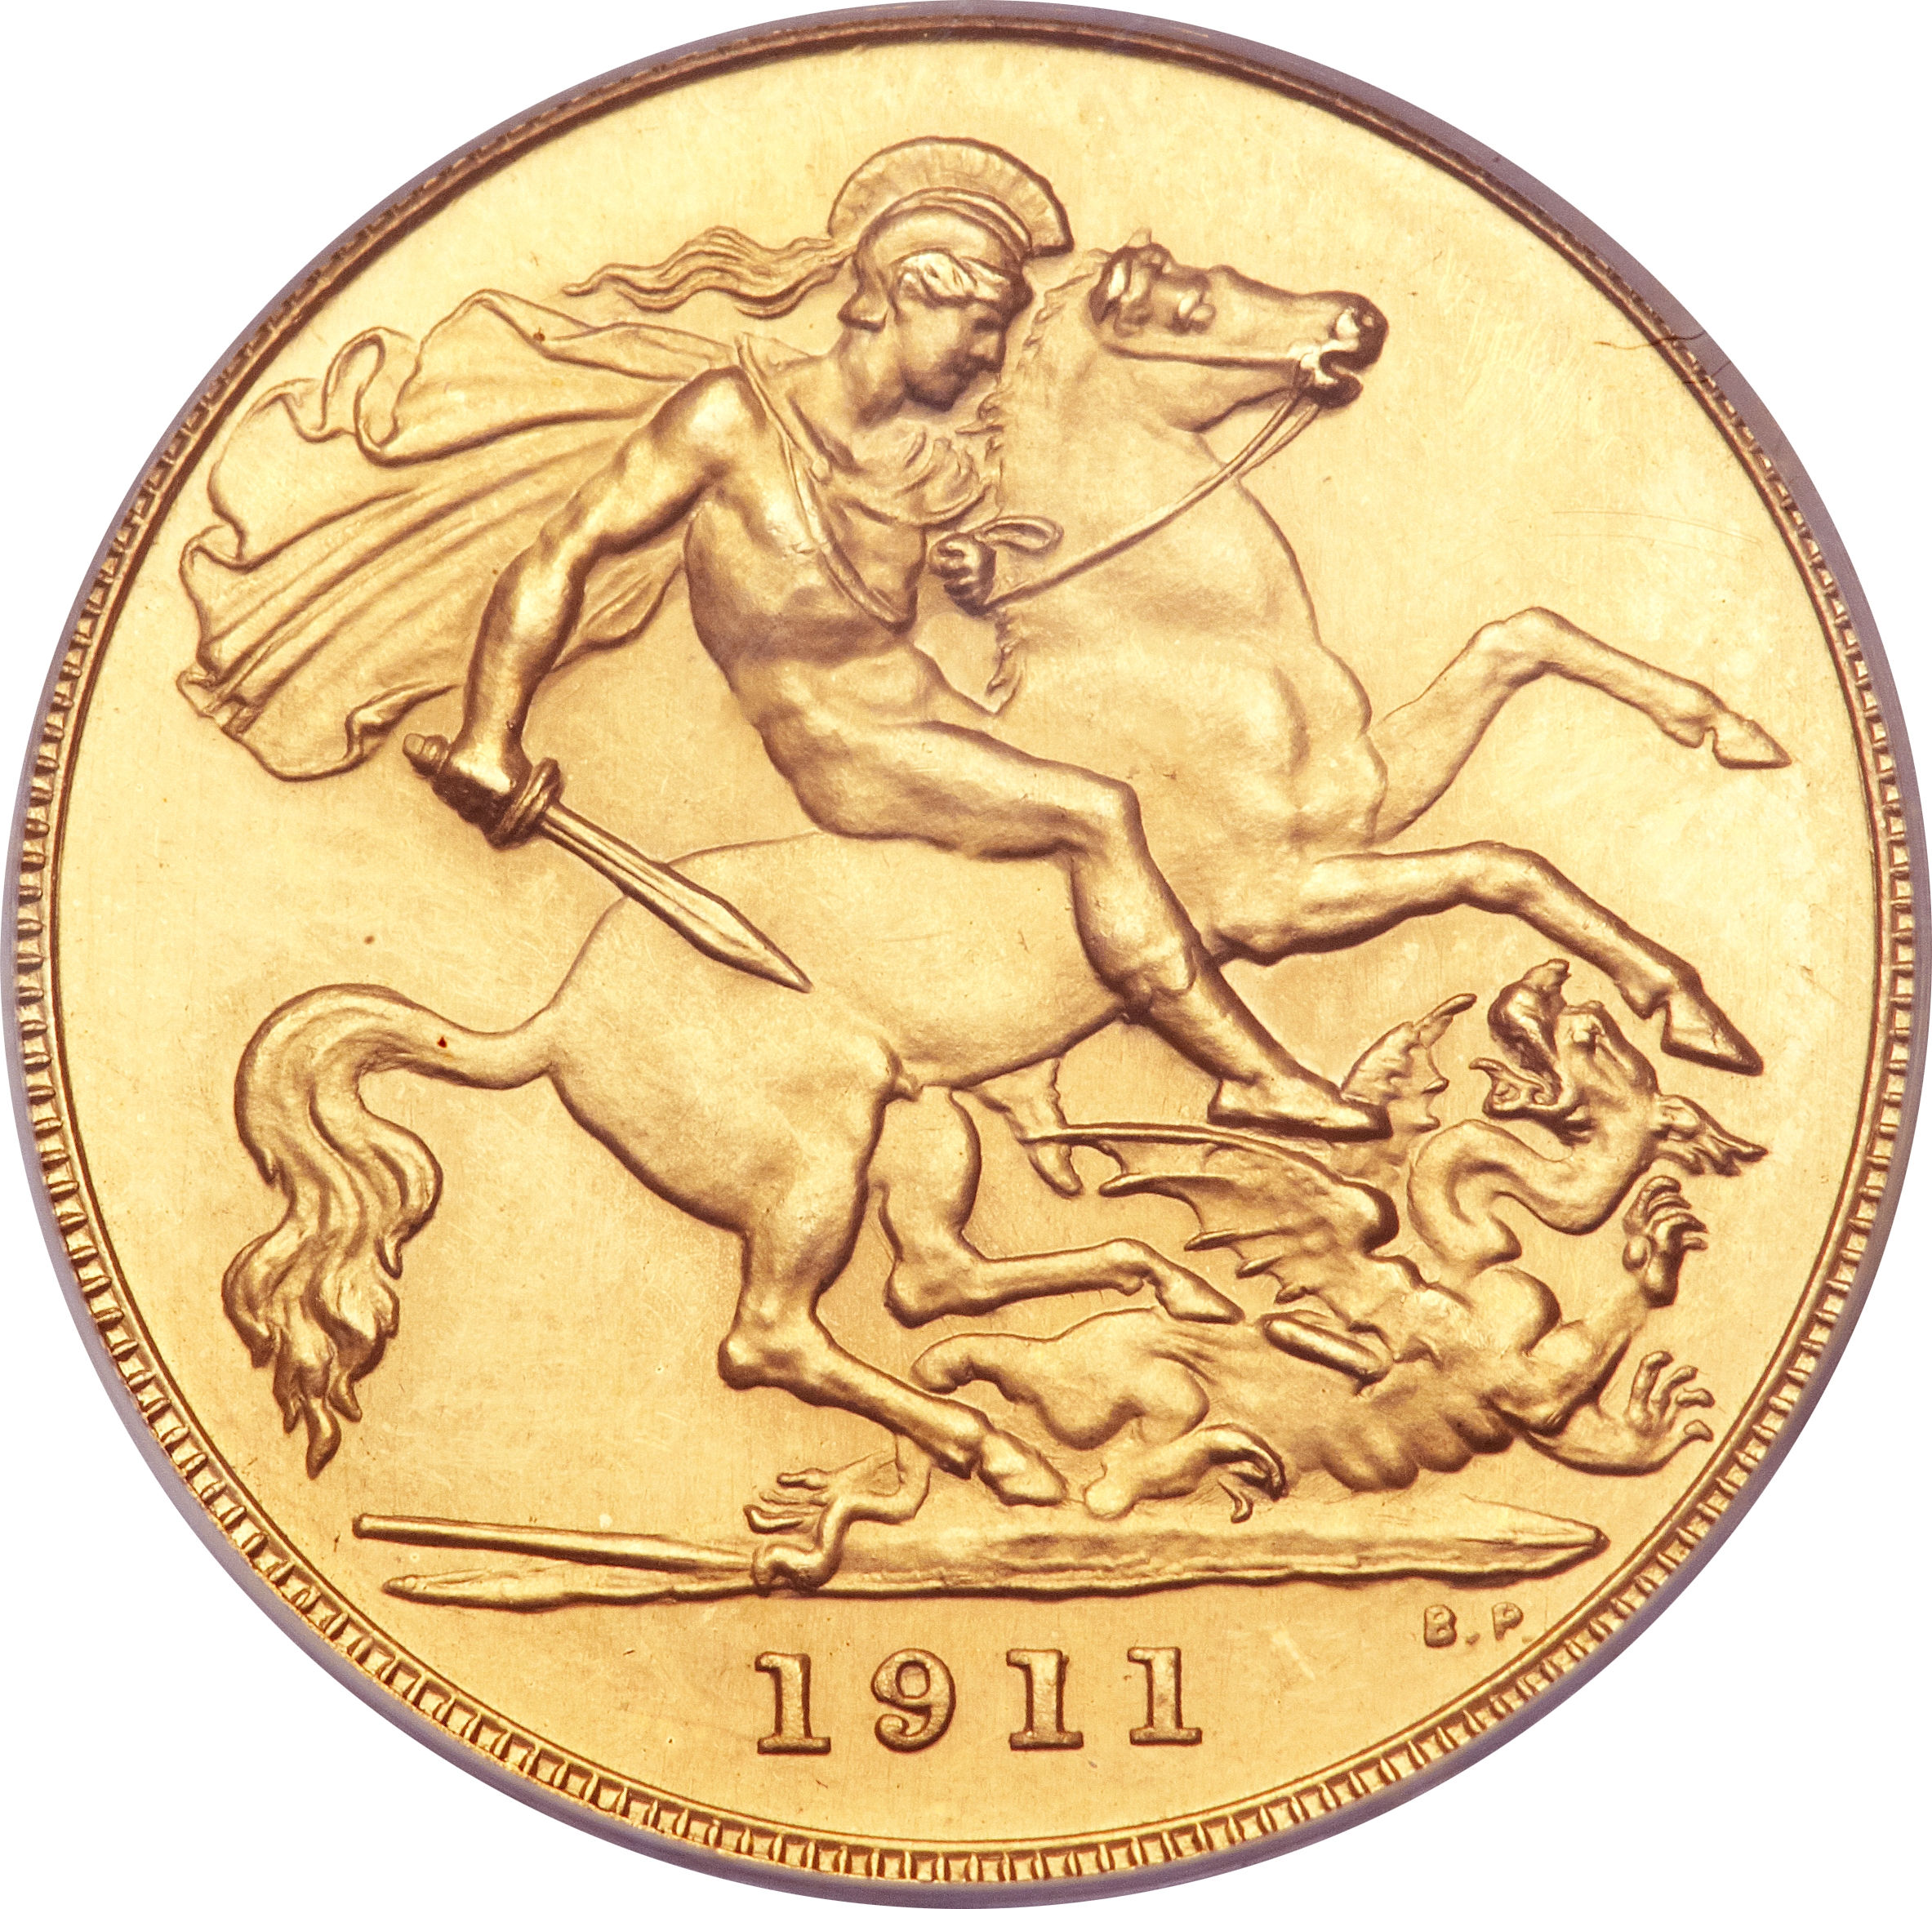
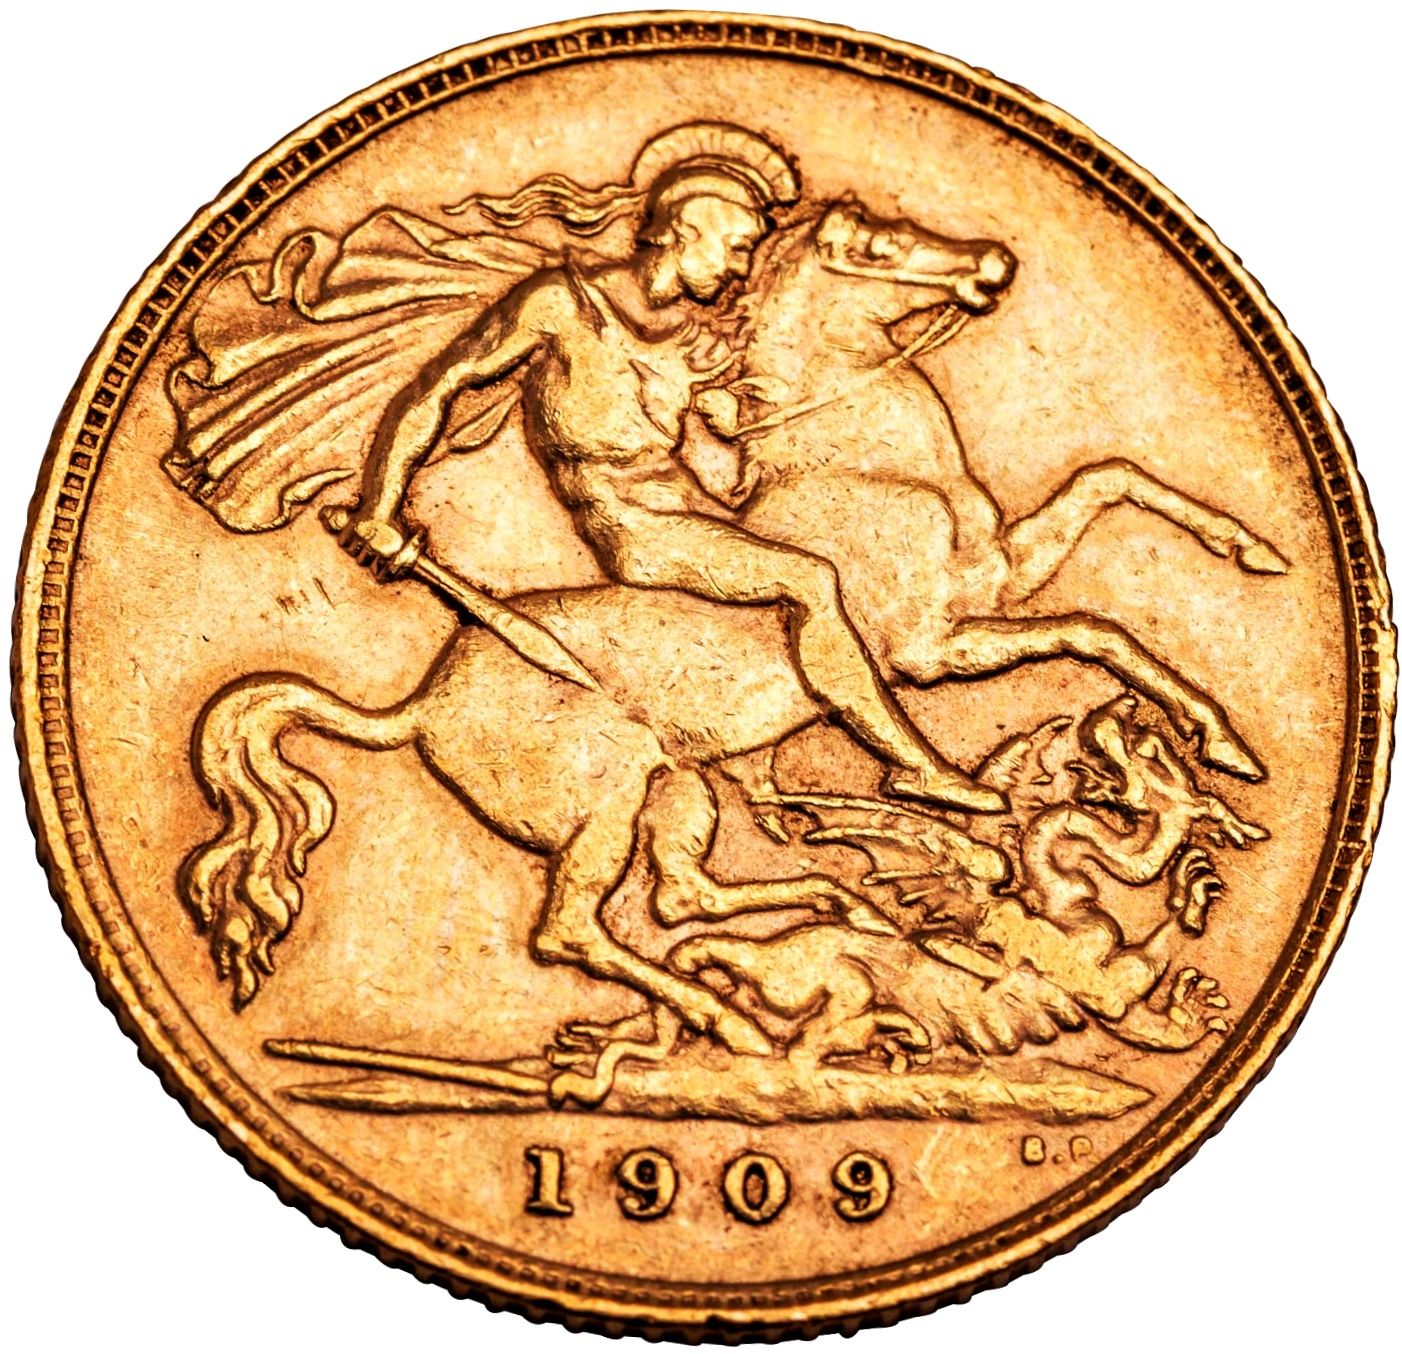
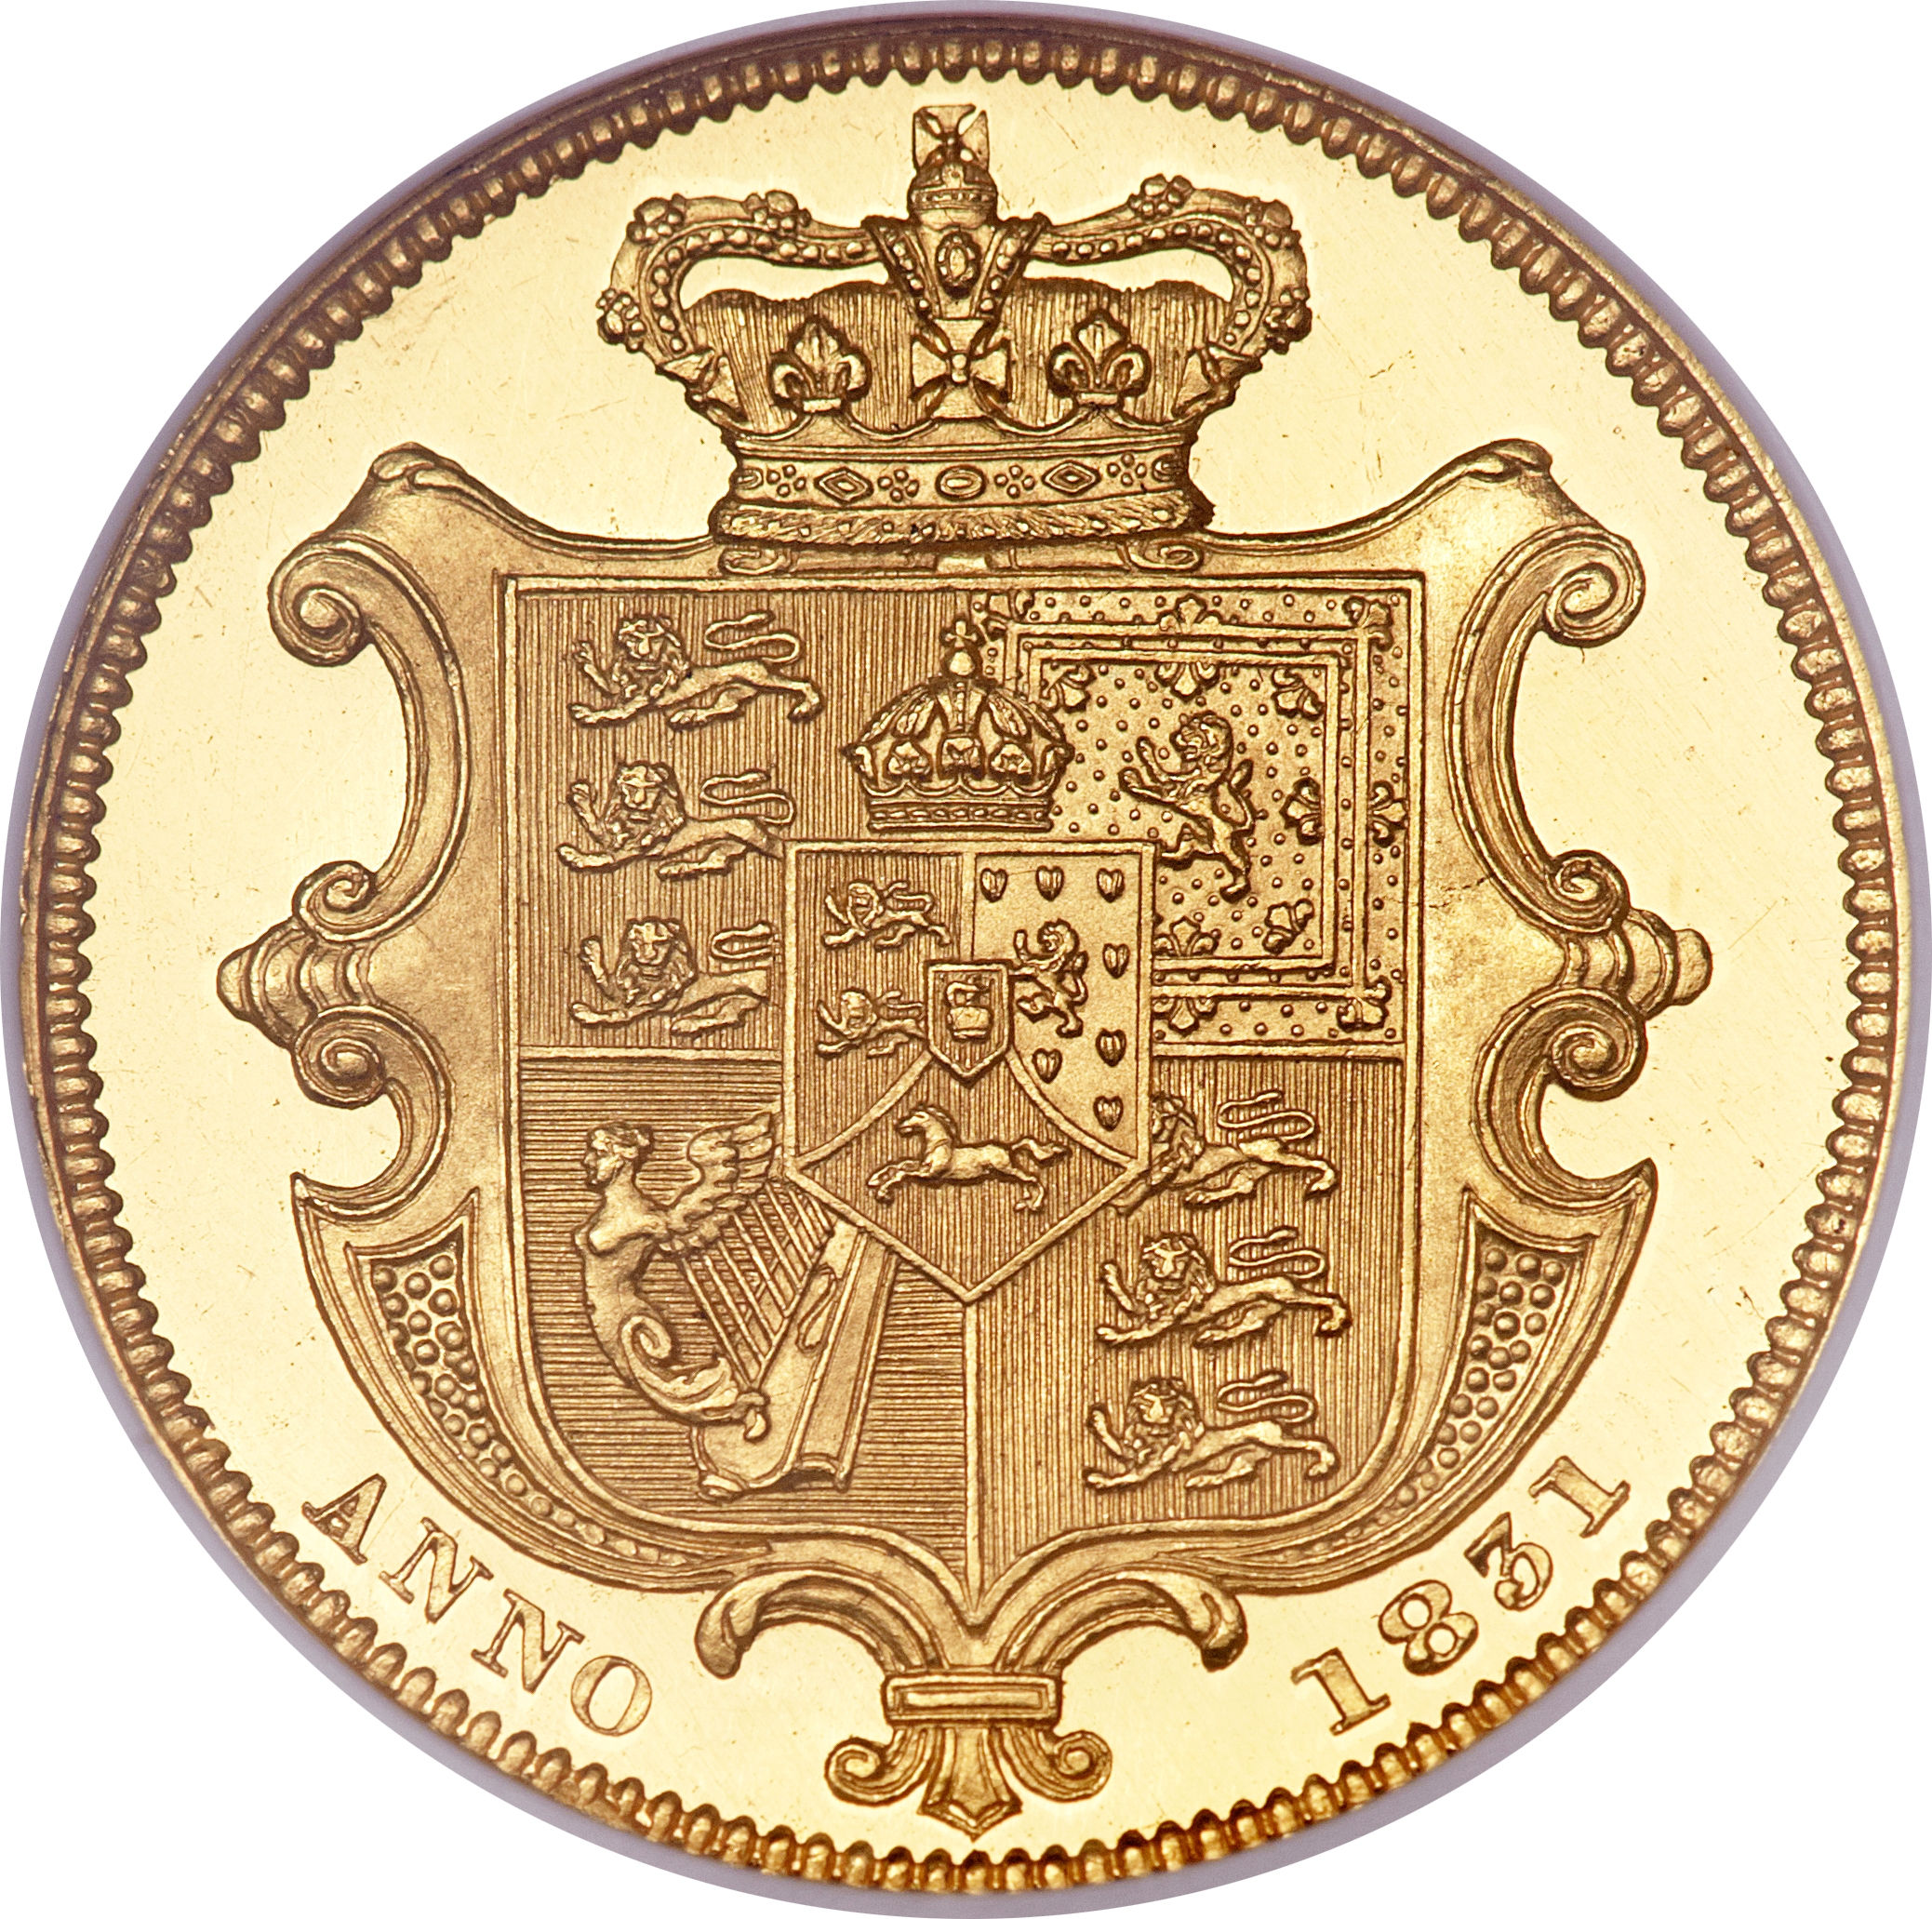
Featured sovereigns on MyCoinage
Frequently asked questions
Which sovereign years are worth the most?
How is the value column calculated?
Why do some years show no value?
Does condition change these values?
Why is the bullion floor so important for sovereign values?
Are half sovereign values just half of full sovereign values?
Which mint marks matter for sovereigns by year?
How often does this chart update?
Further reading
- Sovereign weight specifications — the numbers behind every authentication test.
- The 1817 first modern sovereign — where the chart begins.
- MyCoinage pricing methodology — how sales are collected, verified and aggregated.
- The Royal Mint — official mintage records.